Tag Archives: equity

The Truth About Homeowner Equity


The Truth About Homeowner Equity | MyKCM

A recent article from a reputable news source was titled: Here’s why some homeowners still can’t sell. In the opening bullets of the article, the author claimed, “Negative equity is one of the main reasons why there are so few homes for sale.” The article then goes on to soften that stance but we want to bring better clarity to the equity situation.

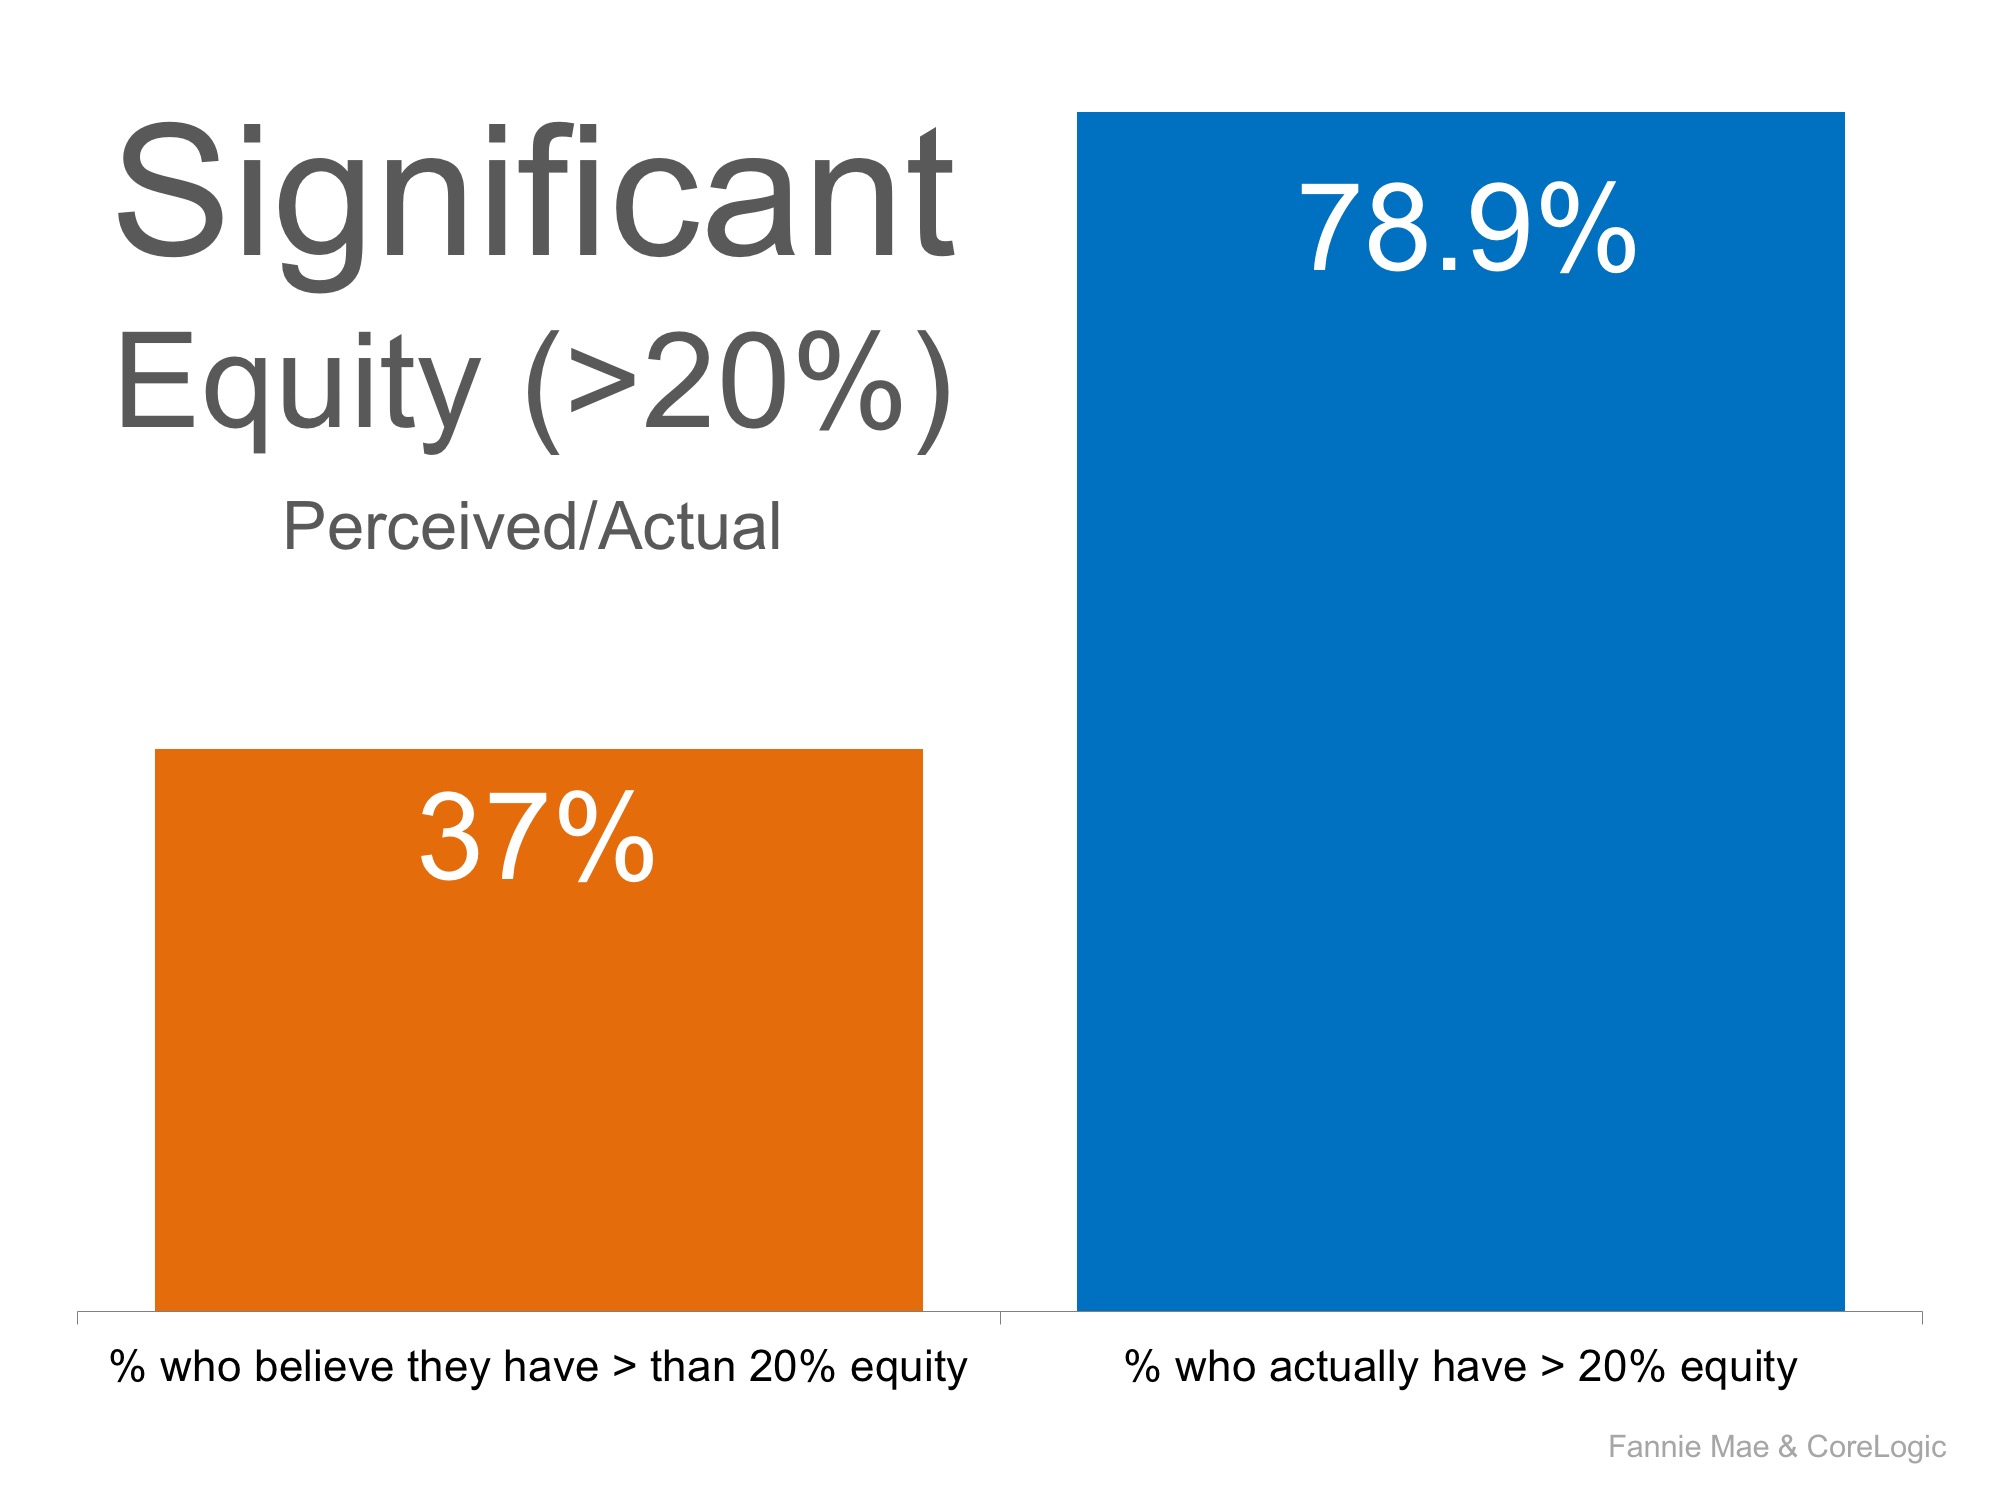
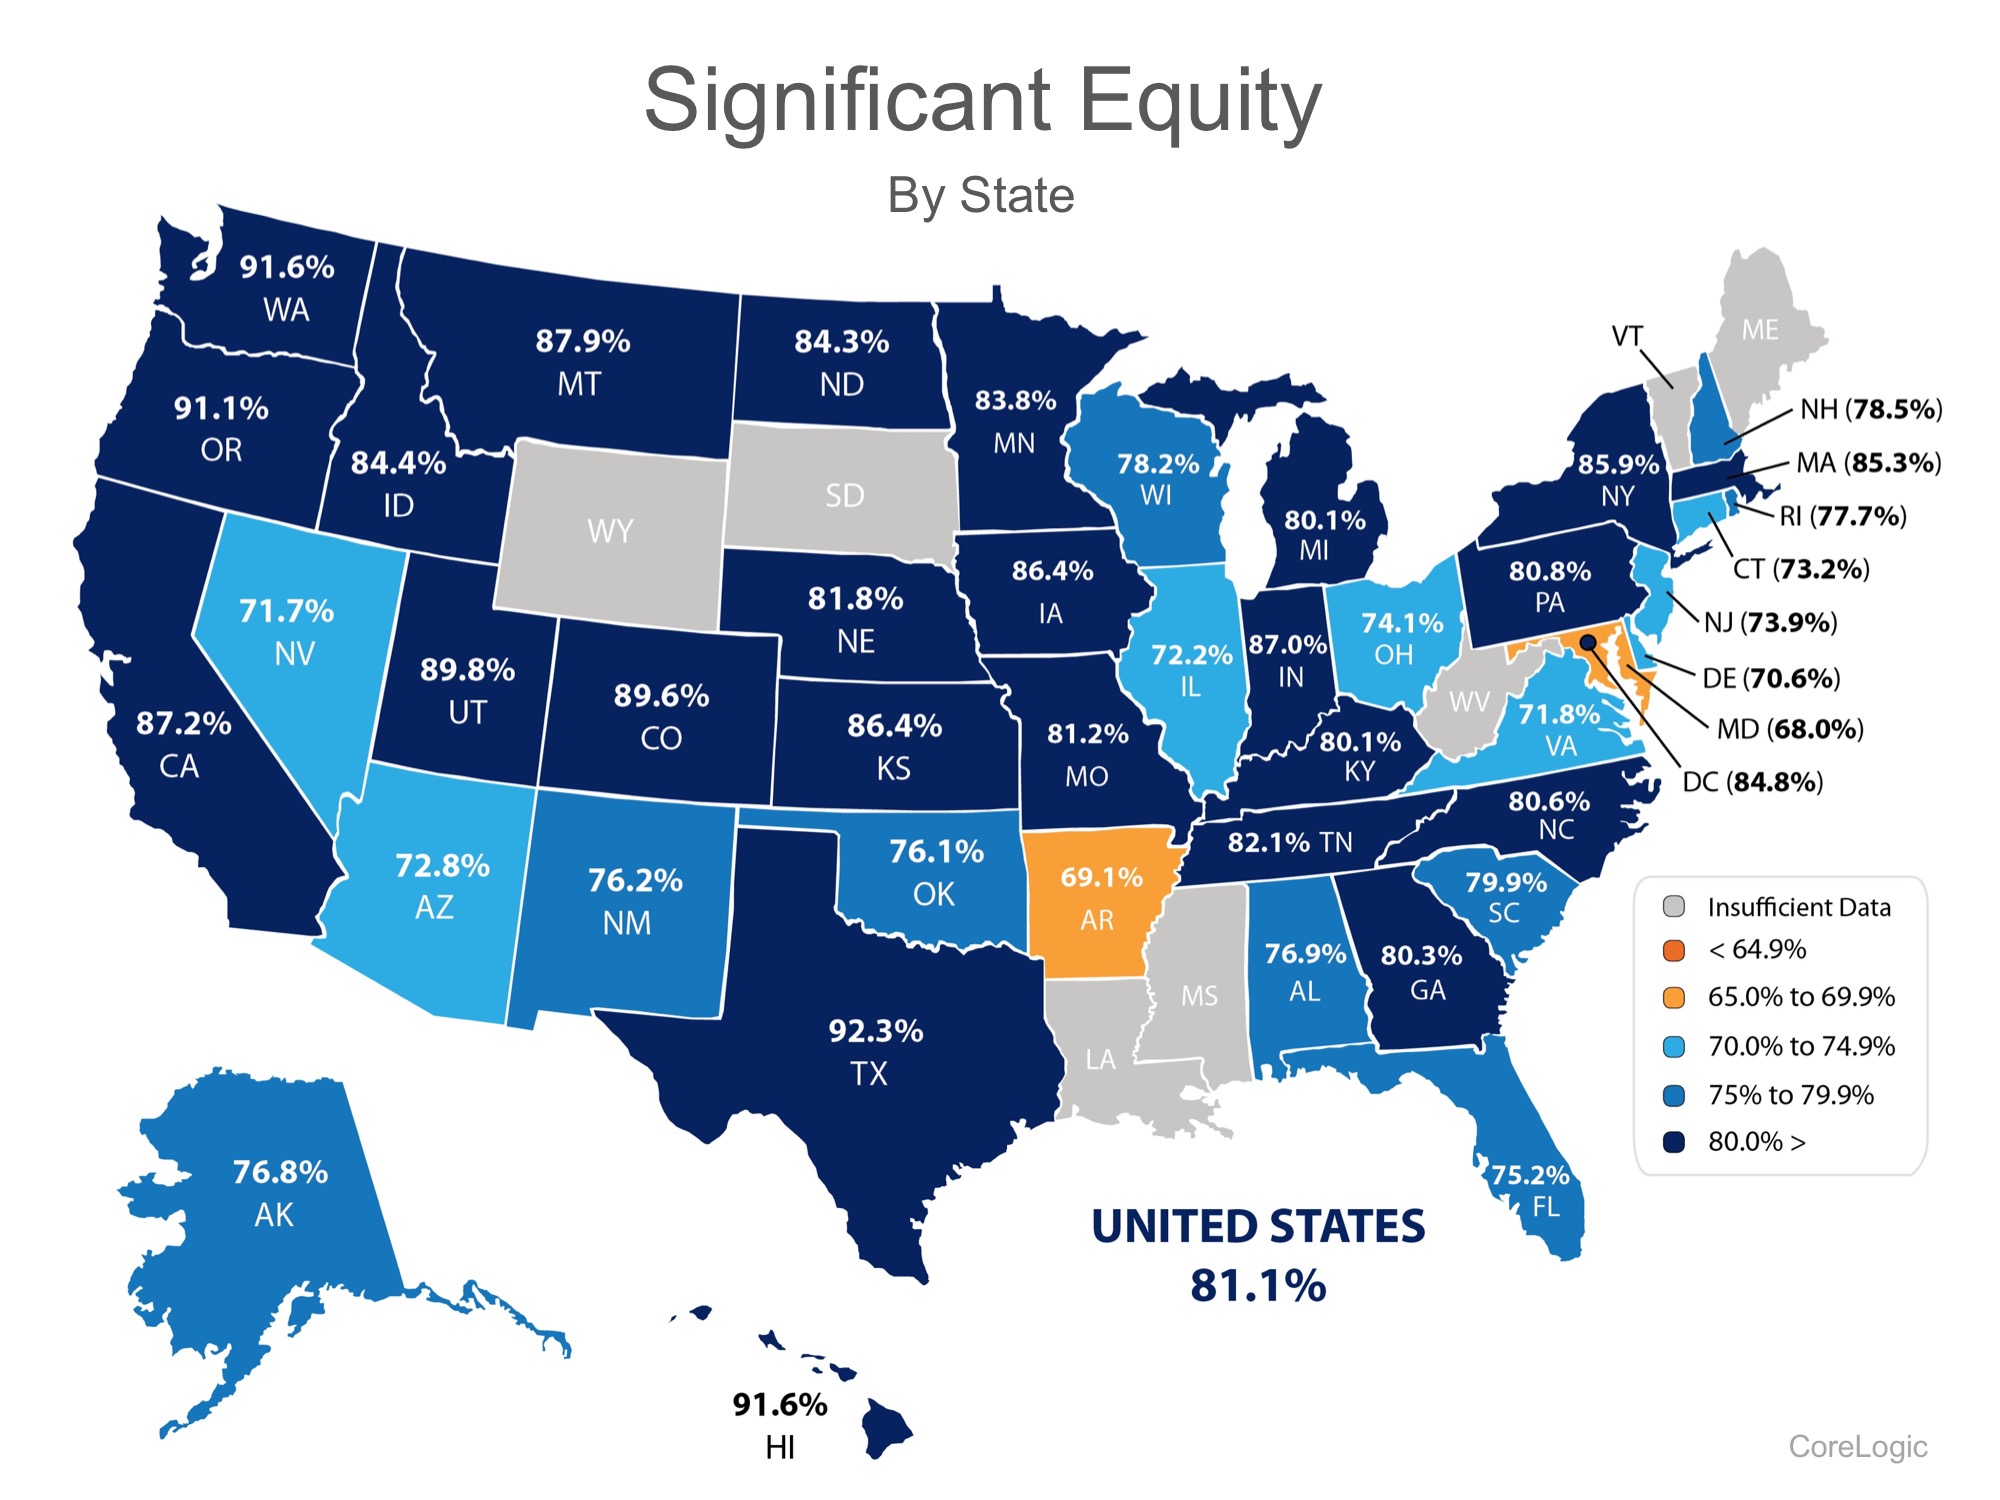
A recent report from CoreLogic (which was quoted in the article) revealed that over 80% of all homes now have “significant equity,” which means the home has over 20% equity. That level of equity allows the homeowner to sell their home if they so desire. (There was no reference to significant equity in the article.)

If eight out of ten homeowners now have significant equity in their homes, it is hard to make the claim that lack of equity is “one of the main reasons why there are so few homes for sale.”

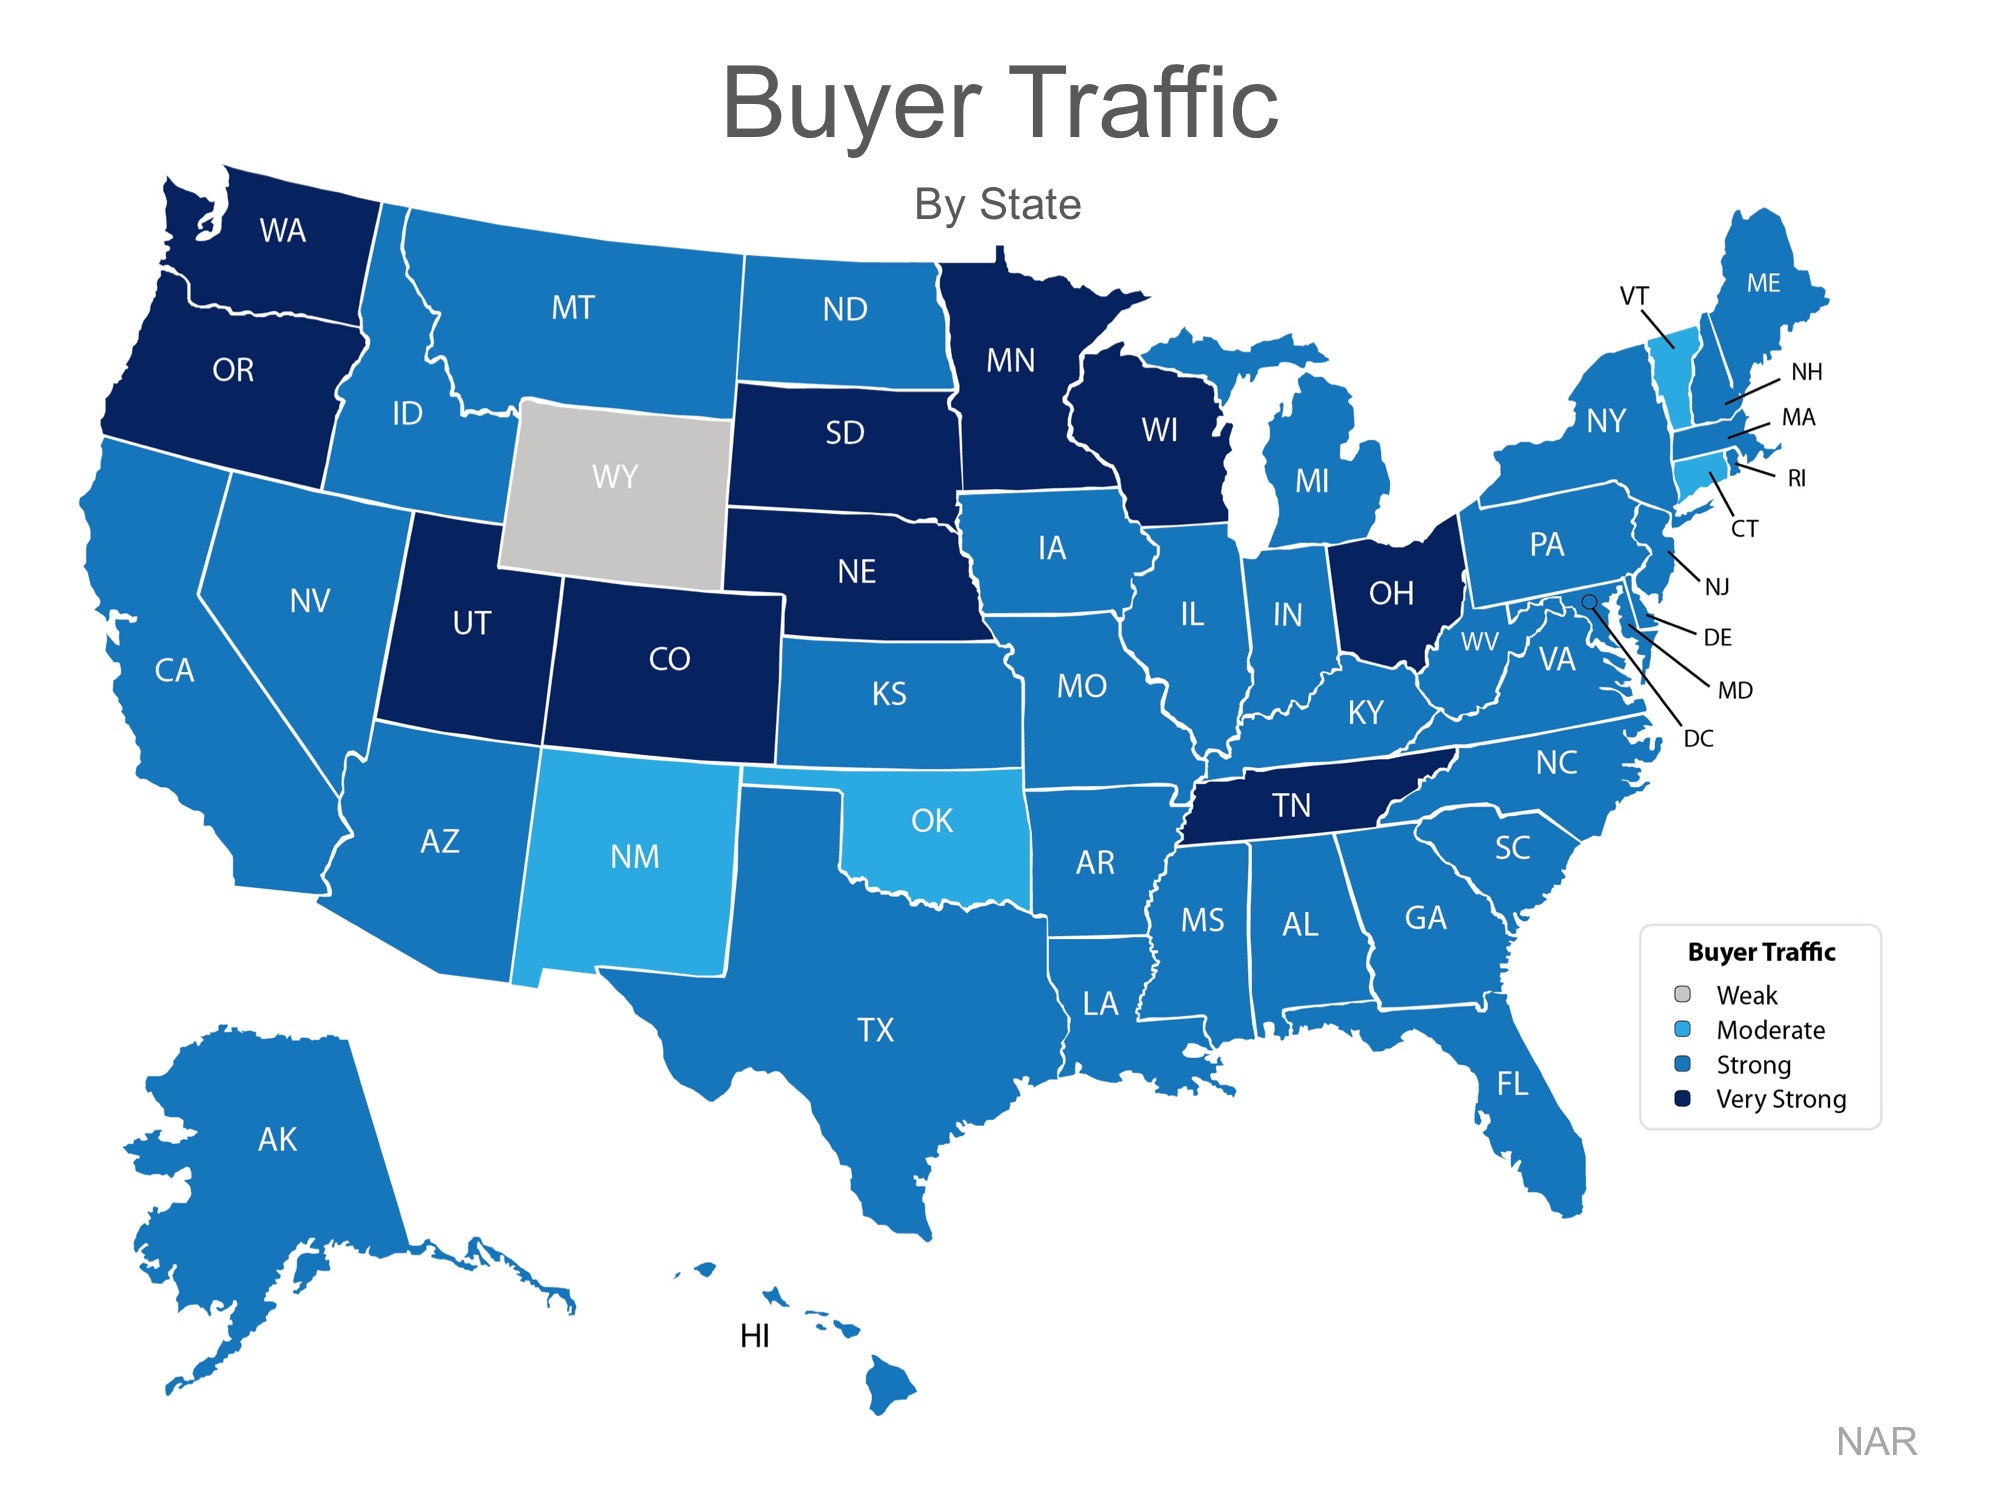
Here is a map showing the percentage of homes in each state which currently have significant equity:

The Truth About Homeowner Equity | MyKCM

Bottom Line

If you are one of many homeowners who is debating selling your home and are wondering how much equity you have accumulated, let’s get together to determine if now is the time to list.

More Americans Say Now is a Good Time to Sell!


More Americans Say Now is a Good Time to Sell! | MyKCM

Recently released data from Fannie Mae’s National Housing Survey revealed that rising home prices were the catalyst behind an eight-point jump in the net percentage of respondents who say now is a good time to sell. The index is now 21 points higher than it was this time last year.

Overall, 62% of Americans surveyed said that now is a good time to sell (up from 58%), while 26% of respondents said that now is not a good time to sell (down from 30%). The net score is the difference between the two percentages, or 36%.

According to CoreLogic, home prices are now up 6.7% over last year and 78.8% of homeowners with a mortgage in the US now have significant equity (defined as 20% or more).

As home prices have increased, more and more homeowners have realized that now is a good time to sell their homes in order to take advantage of the extra equity they now have.

At the same time, however, rising prices have had the exact opposite impact on the good-time-to-buy scale as many buyers are nervous that they will not be able to afford a home; the net score dropped 5 points to 18%.

Doug Duncan, Vice President & Chief Economist at Fannie Mae, had this to say,

“In the early stages of the economic expansion, home selling sentiment trailed home buying sentiment by a significant margin. The reverse is true today.

The net good time to sell share is now double the net good time to buy share, with record high percentages of consumers citing home prices as the primary reason for both perceptions. Such a sizable gap between selling and buying sentiment, if it persists, could weigh on the housing market through the rest of the year.”

Buyer demand continues to outpace the supply of homes for sale, which has driven prices up across the country. Until the supply starts to better match demand, there will be a gap between the sentiments surrounding buying and selling.

Bottom Line

If you are considering listing your home for sale this year, now is the time!

Homeowners: Do You Know Your Home’s Value?


Homeowners: Do You Know Your Home’s Value? | MyKCM

The latest edition of CoreLogic’s Home Price Index shows that nationally, home prices have appreciated 6.7% over the last year and 0.9% month-over-month. The release of the report included this headline,

“National Home Prices Now 50% Above March 2011 Bottom”

The real estate market has come a long way since 2011, which is great news for homeowners!

Nearly 79% of homeowners with a mortgage in the US now have significant equity in their homes (defined as over 20%), according to the latest Equity Report. The challenge is that not every homeowner knows how much their home’s value has appreciated.

Homeowners in Denver, CO lead the way with 8.7% appreciation over the last year, while owners in Washington and Utah have experienced a 3% increase in values since the start of this year!

Nationally, CoreLogic forecasts that home values will increase another 5.0% by this time next year.

Bill Banfield, VP of Capital Markets at Quicken Loans, recently explained the importance of knowing the conditions in your area,

“With home values constantly changing, and the rates of change varying across the country, this is one more way to show how important it is for homeowners to stay aware of their local housing market.”

Bottom Line

Do you know what your house is worth? Have you stayed put because you are nervous you won’t have enough equity to buy your dream home? Let’s get together to perform an equity analysis and give you the freedom to achieve your dreams.

Do You Know How Much Equity You Have in Your Home?


Do You Know How Much Equity You Have in Your Home? | MyKCM

CoreLogic’s latest Equity Report revealed that 91,000 properties regained equity in the first quarter of 2017. This is great news for the country, as 48.2 million of all mortgaged properties are now in a positive equity situation.

Price Appreciation = Good News for Homeowners

Frank Nothaft, CoreLogic’s Chief Economist, explains:

One million borrowers achieved positive equity over the last year, which means risk continues to steadily decline as a result of increasing home prices.”

Frank Martell, President and CEO of CoreLogic, believes this is a great sign for the market in 2017 as well, as he had this to say:

Homeowner equity increased by $766 billion over the last year, the largest increase since Q2 2014. The rising cushion of home equity is one of the main drivers of improved mortgage performance. Since home equity is the largest source of homeowner wealth, the increase in home equity also supports consumer balance sheets, spending and the broader economy.”

This is great news for homeowners! But, do they realize that their equity position has changed?

According to the Fannie Mae’s Home Purchase Sentiment Index (HPSI), more homeowners are beginning to realize that they may have more equity than they first thought.

This is only the second time in the survey’s history that the net share of those saying it’s a good time to sell surpassed the net share of those saying it’s a good time to buy.

78.8% of homeowners have significant equity (more than 20%) in their homes today!

This means that many Americans with a mortgage have an opportunity to take advantage of today’s seller’s market. With a sizeable equity position, many homeowners could easily move into a housing situation that better meets their current needs (moving to a larger home or downsizing).

Doug Duncan, Senior Vice President and Chief Economist at Fannie Mae spoke out on this issue:

“High home prices have led many consumers to give us the first clear indication we’ve seen in the National Housing Survey’s seven-year history that they think it’s now a seller’s market. However, we continue to see a lack of housing supply as many potential sellers are unwilling or unable to put their homes on the market…” 

Bottom Line

If you are one of the many Americans who is unsure of how much equity you have built in your home, don’t let that be the reason you fail to move on to your dream home in 2017! Let’s get together to evaluate your situation!

Homeownership Is a Good Financial Investment!


Homeownership Is a Good Financial Investment! | MyKCM

According to a recent report by Trulia“buying is cheaper than renting in 100 of the largest metro areas by an average of 33.1%.” The report may have some people thinking about buying a home instead of signing another lease extension, but does that make sense from a financial perspective?

Ralph McLaughlin, Trulia’s Chief Economist explains:

“Owning a home is one of the most common ways households build long-term wealth, as it acts like a forced savings account. Instead of paying your landlord, you can pay yourself in the long run through paying down a mortgage on a house.”

The article listed five reasons why owning a home makes financial sense:

  1. Mortgage payments can be fixed while rents go up.
  2. Equity in your home can be a financial resource later.
  3. You can build wealth without paying capital gains.
  4. A mortgage can act as a forced savings account.
  5. Overall, homeowners can enjoy greater wealth growth than renters.

Bottom Line

Before you sign another lease, let’s get together and discuss all your options.

Get All the Facts about PMI


Get All the Facts about PMI | MyKCM

When it comes to buying a home, whether it is your first time or your fifth, it is always important to know all the facts. With the large number of mortgage programs available that allow buyers to purchase a home with a down payment below 20%, you can never have too much information about Private Mortgage Insurance (PMI).

What is PMI?

Freddie Mac defines PMI as:

“An insurance policy that protects the lender if you are unable to pay your mortgage. It’s a monthly fee, rolled into your mortgage payment, that is required for all conforming, conventional loans that have down payments less than 20%.

Once you’ve built equity of 20% in your home, you can cancel your PMI and remove that expense from your mortgage payment.”

As the borrower, you pay the monthly premiums for the insurance policy, and the lender is the beneficiary. Freddie Mac goes on to explain that:

“The cost of PMI varies based on your loan-to-value ratio – the amount you owe on your mortgage compared to its value – and credit score, but you can expect to pay between $30 and $70 per month for every $100,000 borrowed.” 

According to the National Association of Realtors, the average down payment for all buyers last year was 10%. For first-time buyers, that number dropped to 6%, while repeat buyers put down 14% (no doubt aided by the sale of their home). This just goes to show that for a large number of buyers last year, PMI did not stop them from buying their dream homes.

Here’s an example of the cost of a mortgage on a $200,000 home with a 5% down payment & PMI, compared to a 20% down payment without PMI:

Get All the Facts about PMI | MyKCM


The larger the down payment you can make, the lower your monthly housing cost will be, but Freddie Mac urges you to remember:

“It’s no doubt an added cost, but it’s enabling you to buy now and begin building equity versus waiting 5 to 10 years to build enough savings for a 20% down payment.”

Bottom Line

If you have questions about whether you should buy now or wait until you’ve saved a larger down payment, let’s get together to discuss our market’s conditions and to help you make the best decision for you and your family.

3 Charts That Shout, ‘List Your Home Today!’


3 Charts That Shout, ‘List Your Home Today!’ | MyKCM

In school, we all learned the theory of supply and demand. When the demand for an item is greater than the supply of that item, the price will surely rise.

SUPPLY

The National Association of Realtors (NAR) recently reported that the inventory of homes for sale stands at a 3.8-month supply. This is considerably lower than the 6-month supply necessary for a normal market.

3 Charts That Shout, ‘List Your Home Today!’ | MyKCM


DEMAND

Every month NAR reports on the number of buyers out in the market looking for homes, which is also known as buyer traffic. As seen on the map below, buyer demand in March was strong or very strong in 45 out of 50 states nationwide, and Washington, DC.

3 Charts That Shout, ‘List Your Home Today!’ | MyKCM

Many buyers are being confronted with a very competitive market in which they must compete with other buyers for their dream homes (if they are even able to find a home they wish to purchase).

Listing your house for sale now will allow you to capitalize on the shortage of homes for sale in the market, which will translate into a better pricing situation.

HOME EQUITY

Many homeowners underestimate the amount of equity they currently have in their homes. According to a recent Fannie Mae study, 37% of homeowners believe that they have more than 20% equity in their homes. In reality, CoreLogic’s latest Equity Report tells us that 78.9% actually do!

3 Charts That Shout, ‘List Your Home Today!’ | MyKCM

Many homeowners who are undervaluing the equity they have in their homes may feel trapped, which may be contributing to the lack of inventory in the market.

Bottom Line

If you are debating selling your home this year, let’s meet up to evaluate the equity you have in your home, as well as the opportunities available in your market.

The Connection Between Home Prices & Family Wealth

The Connection Between Home Prices & Family Wealth | Simplifying The Market

Over the next five years, home prices are expected to appreciate 3.22% per year on average and to grow by 17.3% cumulatively, according to Pulsenomics’ most recent Home Price Expectation Survey.

So, what does this mean for homeowners and their equity position?

As an example, let’s assume a young couple purchased and closed on a $250,000 home in January. If we look at only the projected increase in the price of that home, how much equity will they earn over the next 5 years?

The Connection Between Home Prices & Family Wealth | Simplifying The Market

Since the experts predict that home prices will increase by 4.4% this year alone, the young homeowners will have gained $11,000 in equity in just one year.

Over a five-year period, their equity will increase by nearly $43,000! This figure does not even take into account their monthly principal mortgage payments. In many cases, home equity is one of the largest portions of a family’s overall net worth.

Bottom Line

Not only is homeownership something to be proud of, but it also offers you and your family the ability to build equity you can borrow against in the future. If you are ready and willing to buy, find out if you are able to today!

How Long do Most Families Stay in Their Home?

How Long Do Most Families Stay in Their Home? | Simplifying The Market

The National Association of Realtors (NAR) keeps historical data on many aspects of homeownership. One of the data points that has changed dramatically is the median tenure of a family in a home. As the graph below shows, for over twenty years (1985-2008), the median tenure averaged exactly six years. However, since 2008, that average is almost nine years – an increase of almost 50%.

How Long Do Most Families Stay in Their Home? | Simplifying The Market

Why the dramatic increase?

The reasons for this change are plentiful!

The fall in home prices during the housing crisis left many homeowners in a negative equity situation (where their home was worth less than the mortgage on the property). Also, the uncertainty of the economy made some homeowners much more fiscally conservative about making a move.

With home prices rising dramatically over the last several years, 93.7% of homes with a mortgage are now in a positive equity situation with 79.1% of them having at least 20% equity, according to CoreLogic.

With the economy coming back and wages starting to increase, many homeowners are in a much better financial situation than they were just a few short years ago.

One other reason for the increase was brought to light during a recent presentation by Lawrence Yun, the Chief Economist of NAR, at the Realtor’s Summit in San Diego, CA. Yun pointed to the fact that historically, young homeowners who were either looking for more space to accommodate their growing family or looking for a better school district were more likely to move more often (every 5 years). The homeownership rate among young families, however, has still not caught up to previous generations resulting in the jump we have seen in median tenure!

What does this mean for housing?

Many believe that a large portion of homeowners are not in a house that is best for their current family circumstances. They could be baby boomers living in an empty, four-bedroom colonial, or a millennial couple planning to start a family that currently lives in a one-bedroom condo.

These homeowners are ready to make a move. Since the lack of housing inventory is a major challenge in the current housing market, this could be great news.

Let’s talk Stats Boomers… Ready to Retire?

Thanks for this


Are your retirement plans in place, locked down and solid?  Or do you or maybe your parents fall into the overwhelming statistics below?

  • Baby Boomers are turning 62 at a rate of 10,000 a day.
  • Senior home equity is at an all time high.
  • They live longer, are active, carry debt, and have equity.
  • 25,000,000 households with Americans over 65.
  • 85+ is the fastest growing demographic in America.
  • Federal Reserve estimates 50% of Boomers with no retirement savings.
  • $49,800 average savings of those who have saved.
  • $51,000 is average annual cost of assisted living.
  • 80% of seniors have substantial equity in their homes.
  • 81% of seniors plan to remain in their homes as long as possible
  • 43% of current HECM seniors report that without their Reverse Mortage, they could not remain in their home.
  • 23% married social security beneficiaries  receive 90% of their income from SSI.
  • 43% Single social security beneficiaries receive over 90% of their income from SSI.
  • 30% gap between social security and desired monthly income
  • Inflationary pressures on Fixed Income.
  • Health care costs continue to rise.
  • ZERO alternative sources of additional monthly cash for most seniors other than home equity.