Category Archives: Daily Updates

Mortgage Rates Impact on 2017 Home Values

Mortgage Rates Impact on 2017 Home Values | Simplifying The Market

There is no doubt that historically low mortgage interest rates were a major impetus to housing recovery over the last several years. However, many industry experts are showing concern about the possible effect that the rising rates will have moving forward.

The Mortgage Bankers Association, Fannie Mae, Freddie Mac and the National Association of Realtors are all projecting that mortgage interest rates will move upward in 2017. Increasing interest rates will definitely impact purchasers and may stifle demand.

In a recent study of industry experts, “rising mortgage interest rates, and their impact on mortgage affordability” was named by 56% as the force they think will have the most significant impact on U.S. housing in 2017. If rising rates slow demand for housing, home values will be impacted.

To this point, Pulsenomics, recently surveyed a panel of over 100 economists, investment strategists, and housing market analysts, asking the question “In your opinion, at what level will the 30-year fixed rate mortgage rate significantly slow home value appreciation?” The survey revealed the following:

Mortgage Rates Impact on 2017 Home Values | Simplifying The Market

Bottom Line

Most experts believe that rates would need to hit 5% or above to have an impact on home prices.

Over Half of All Buyers Are Surprised by Closing Costs

Over Half of All Buyers Are Surprised by Closing Costs | Simplifying The Market

According to a recent survey conducted by ClosingCorp, over half of all homebuyers are surprised by the closing costs required to obtain their mortgage.

After surveying 1,000 first-time and repeat homebuyers, the results revealed that 17% of homebuyers were surprised that closing costs were required at all, while another 35% were stunned by how much higher the fees were than expected.

“Homebuyers reported being most surprised by mortgage insurance, followed by bank fees and points, taxes, title insurance and appraisal fees.”

Bankrate.com recently gathered closing cost data from lenders in every state and Washington, D.C. to be able to share the average costs in each state. The map below was created using the closing costs on a $200,000 mortgage with a 20% down payment.

Over Half of All Buyers Are Surprised by Closing Costs | Simplifying The Market

Keep in mind that if you are in the market for a home above this price range. your costs could be significantly more. According to Freddie Mac,

“Closing costs are typically between 2 and 5% of your purchase price.”

Bottom Line

Speak with your lender and agent early and often to determine how much you’ll be responsible for at closing. Finding out that you’ll need to come up with thousands of dollars right before closing is not a surprise anyone is ever looking forward to.

How Long do Most Families Stay in Their Home?

How Long Do Most Families Stay in Their Home? | Simplifying The Market

The National Association of Realtors (NAR) keeps historical data on many aspects of homeownership. One of the data points that has changed dramatically is the median tenure of a family in a home. As the graph below shows, for over twenty years (1985-2008), the median tenure averaged exactly six years. However, since 2008, that average is almost nine years – an increase of almost 50%.

How Long Do Most Families Stay in Their Home? | Simplifying The Market

Why the dramatic increase?

The reasons for this change are plentiful!

The fall in home prices during the housing crisis left many homeowners in a negative equity situation (where their home was worth less than the mortgage on the property). Also, the uncertainty of the economy made some homeowners much more fiscally conservative about making a move.

With home prices rising dramatically over the last several years, 93.7% of homes with a mortgage are now in a positive equity situation with 79.1% of them having at least 20% equity, according to CoreLogic.

With the economy coming back and wages starting to increase, many homeowners are in a much better financial situation than they were just a few short years ago.

One other reason for the increase was brought to light during a recent presentation by Lawrence Yun, the Chief Economist of NAR, at the Realtor’s Summit in San Diego, CA. Yun pointed to the fact that historically, young homeowners who were either looking for more space to accommodate their growing family or looking for a better school district were more likely to move more often (every 5 years). The homeownership rate among young families, however, has still not caught up to previous generations resulting in the jump we have seen in median tenure!

What does this mean for housing?

Many believe that a large portion of homeowners are not in a house that is best for their current family circumstances. They could be baby boomers living in an empty, four-bedroom colonial, or a millennial couple planning to start a family that currently lives in a one-bedroom condo.

These homeowners are ready to make a move. Since the lack of housing inventory is a major challenge in the current housing market, this could be great news.

Where Are the Home Prices Heading in the Next 5 years?

Where Are the Home Prices Heading in the Next 5 Years? | Simplifying The Market

Today, many real estate conversations center on housing prices and where they may be headed. That is why we like the Home Price Expectation Survey.

Every quarter, Pulsenomics surveys a nationwide panel of over one hundred economists, real estate experts, and investment & market strategists about where they believe prices are headed over the next five years. They then average the projections of all 100+ experts into a single number.

The results of their latest survey:

Home values will appreciate by 4.4% over the course of 2017, 3.4% in 2018, 2.8% in 2019, 2.7% in 2020, and 2.8% in 2021. That means the average annual appreciation will be 3.22% over the next 5 years.

Where Are the Home Prices Heading in the Next 5 Years? | Simplifying The Market

The prediction for cumulative appreciation fell from 21.4% to 17.3% by 2021. The experts making up the most bearish quartile of the survey are projecting a cumulative appreciation of 6.3%.

Where Are the Home Prices Heading in the Next 5 Years? | Simplifying The Market

Bottom Line

Individual opinions make headlines. We believe this survey is a fairer depiction of future values.

Existing Home Sales Reach Highest Mark Since 2007

Existing Home Sales Reach Highest Mark Since 2007 [INFOGRAPHIC] | Simplifying The Market

Highlights:

  • Sales of existing homes reached the highest pace in a decade at a seasonally adjusted annual rate of 5.69 million.
  • January marked the 59th consecutive month of year-over-year price gains as the median home price rose 7.1% to $228,900.
  • NAR’s Chief Economist, Lawrence Yun had this to say, “Much of the country saw robust sales activity last month as strong hiring and improved consumer confidence at the end of last year appear to have sparked considerable interest in buying a home.” 

The Impact of Homeownership on Family Health

The Impact of Homeownership on Family Health | Simplifying The Market

The National Association of Realtors recently released a study titled ‘Social Benefits of Homeownership and Stable Housing.’ The study confirmed a long-standing belief of most Americans:

“Owning a home embodies the promise of individual autonomy and is the aspiration of most American households. Homeownership allows households to accumulate wealth and social status, and is the basis for a number of positive social, economic, family and civic outcomes.”

Today, we want to cover the section of the report that quoted several studies concentrating on the impact homeownership has on the health of family members. Here are some of the major findings on this issue revealed in the report:

  • There is a strong positive relationship between living in poor housing and a range of health problems, including respiratory conditions such as asthma, exposure to toxic substances, injuries and mental health. Homes of owners are generally in better condition than those of renters.
  • Findings reveal that increases in housing wealth were associated with better health outcomes for homeowners.
  • Low-income people who recently became homeowners reported higher life satisfaction, higher self-esteem, and higher perceived control over their lives.
  • Homeowners report higher self-esteem and happiness than renters. For example, homeowners are more likely to believe that they can do things as well as anyone else, and they report higher self-ratings on their physical health even after controlling for age and socioeconomic factors.
  • Renters who become homeowners not only experience a significant increase in housing satisfaction but also obtain a higher satisfaction even in the same home in which they resided as renters.
  • Social mobility variables, such as the family financial situation and housing tenure during childhood and adulthood, impacted one’s self-rated health.
  • Homeowners have a significant health advantage over renters, on average. Homeowners are 2.5 percent more likely to have good health. When adjusting for an array of demographic, socioeconomic, and housing–related characteristics, the homeowner advantage is even larger at 3.1 percent.

Bottom Line

People often talk about the financial benefits of homeownership. As we can see, there are also social benefits of owning your own home.

Are You 1 of the 59 Million…

Are You 1 of the 59 Million Planning to Buy This Year? | Simplifying The Market

Are You 1 of the 59 Million Planning to Buy This Year?

According to a survey conducted by Bankrate.com, one in four Americans are considering buying a home this year. If this statistic proves to be true, that means that 59 million people will be looking to enter the housing market in 2017.

The survey also revealed 3 key takeaways:

  1. Those most likely to buy are ‘Older Millennials’ (ages 27-36) or ‘Generation X’ (ages 37-52)
  2. Minorities, particularly African-Americans, were twice as likely to respond that they were considering purchasing a home this year than white respondents.
  3. Many potential buyers believe they need to put 20% down and need to have perfect credit to own and are unaware of programs that would allow them to buy now.

Holden Lewis, a mortgage analyst for Bankrate.com, pointed to one big reason why many Americans are starting to consider homeownership:

“Having kids and raising a family is a primary reason why Americans take the leap into homeownership—many consider it a key component of the American dream.”

Bottom Line

If buying a home is a part of your dream for 2017, let’s get together to determine if you are able to.

Sell Before Spring!

No Matter What the Groundhog Says, Here are 5 Reasons to Sell Before Spring! | Simplifying The Market

No Matter What the Groundhog Says, Here are 5 Reasons to Sell Before Spring!

Is spring closer than we think? Depending on which groundhog you listen to today, you may have less time than you think to get your home on the market before the busy spring season.

Many sellers feel that the spring is the best time to place their homes on the market as buyer demand traditionally increases at that time of year. However, the next six weeks before spring hits also have their own advantages.

Here are five reasons to sell now.

1. Demand is Strong 

Foot traffic refers to the number of people who are out, physically looking at homes right now. The latest foot traffic numbers from the National Association of Realtors (NAR) show that the number of buyers out looking for their dream homes in December reached the highest mark since February 2016.

These buyers are ready, willing and able to buy…and are in the market right now! Take advantage of the strong buyer activity currently in the market.

2. There Is Less Competition Now 

Housing inventory just dropped to a 3.6-month supply, which is well under the 6-month supply needed for a normal housing market. This means, in many areas, there are not enough homes for sale to satisfy the number of buyers in that market. This is good news for home prices; however, additional inventory is about to come to market.

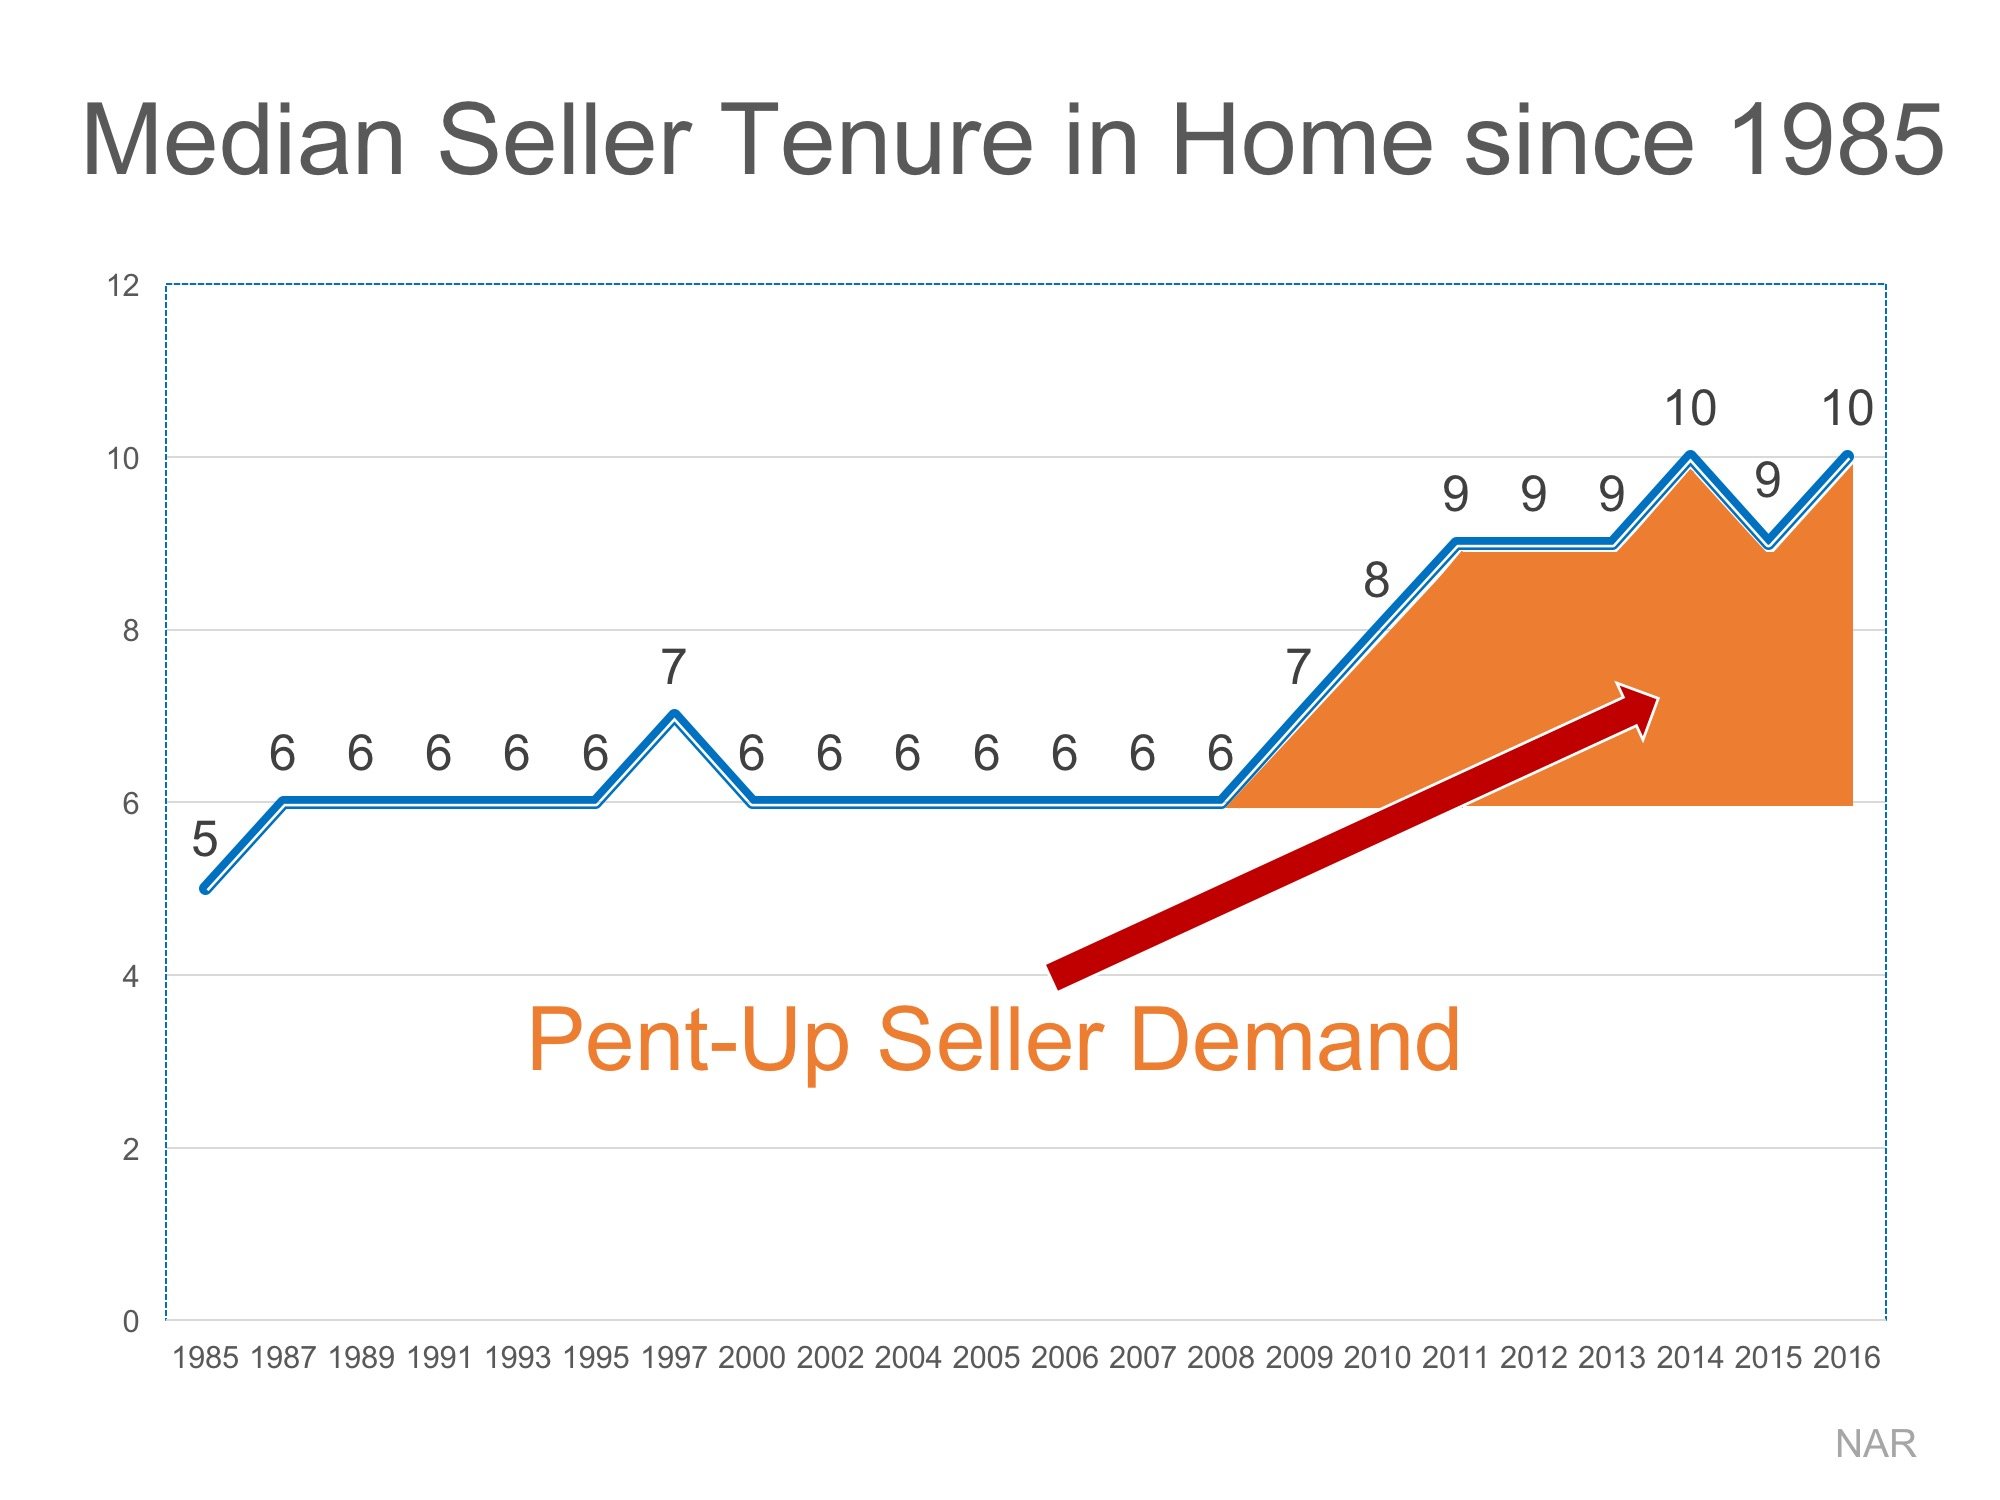
There is a pent-up desire for many homeowners to move, as they were unable to sell over the last few years because of a negative equity situation. Homeowners are now seeing a return to positive equity as real estate values have increased over the last four years. Many of these homes will be coming to market soon.

Also, new construction of single-family homes is again beginning to increase. A study by Harris Poll revealed that 41% of buyers would prefer to buy a new home, while only 21% prefer an existing home (38% had no preference).

The choices buyers have will increase in the spring. Don’t wait for this other inventory to come to market before you sell.

3. The Process Will Be Quicker

One of the biggest challenges of the housing market has been the length of time it takes from contract to closing. Banks are requiring more and more paperwork before approving a mortgage. There is less overall business done in the winter. Therefore, the process will be less onerous than it will be in the spring. Getting your house sold and closed before the spring delays begin will lend to a smoother transaction.

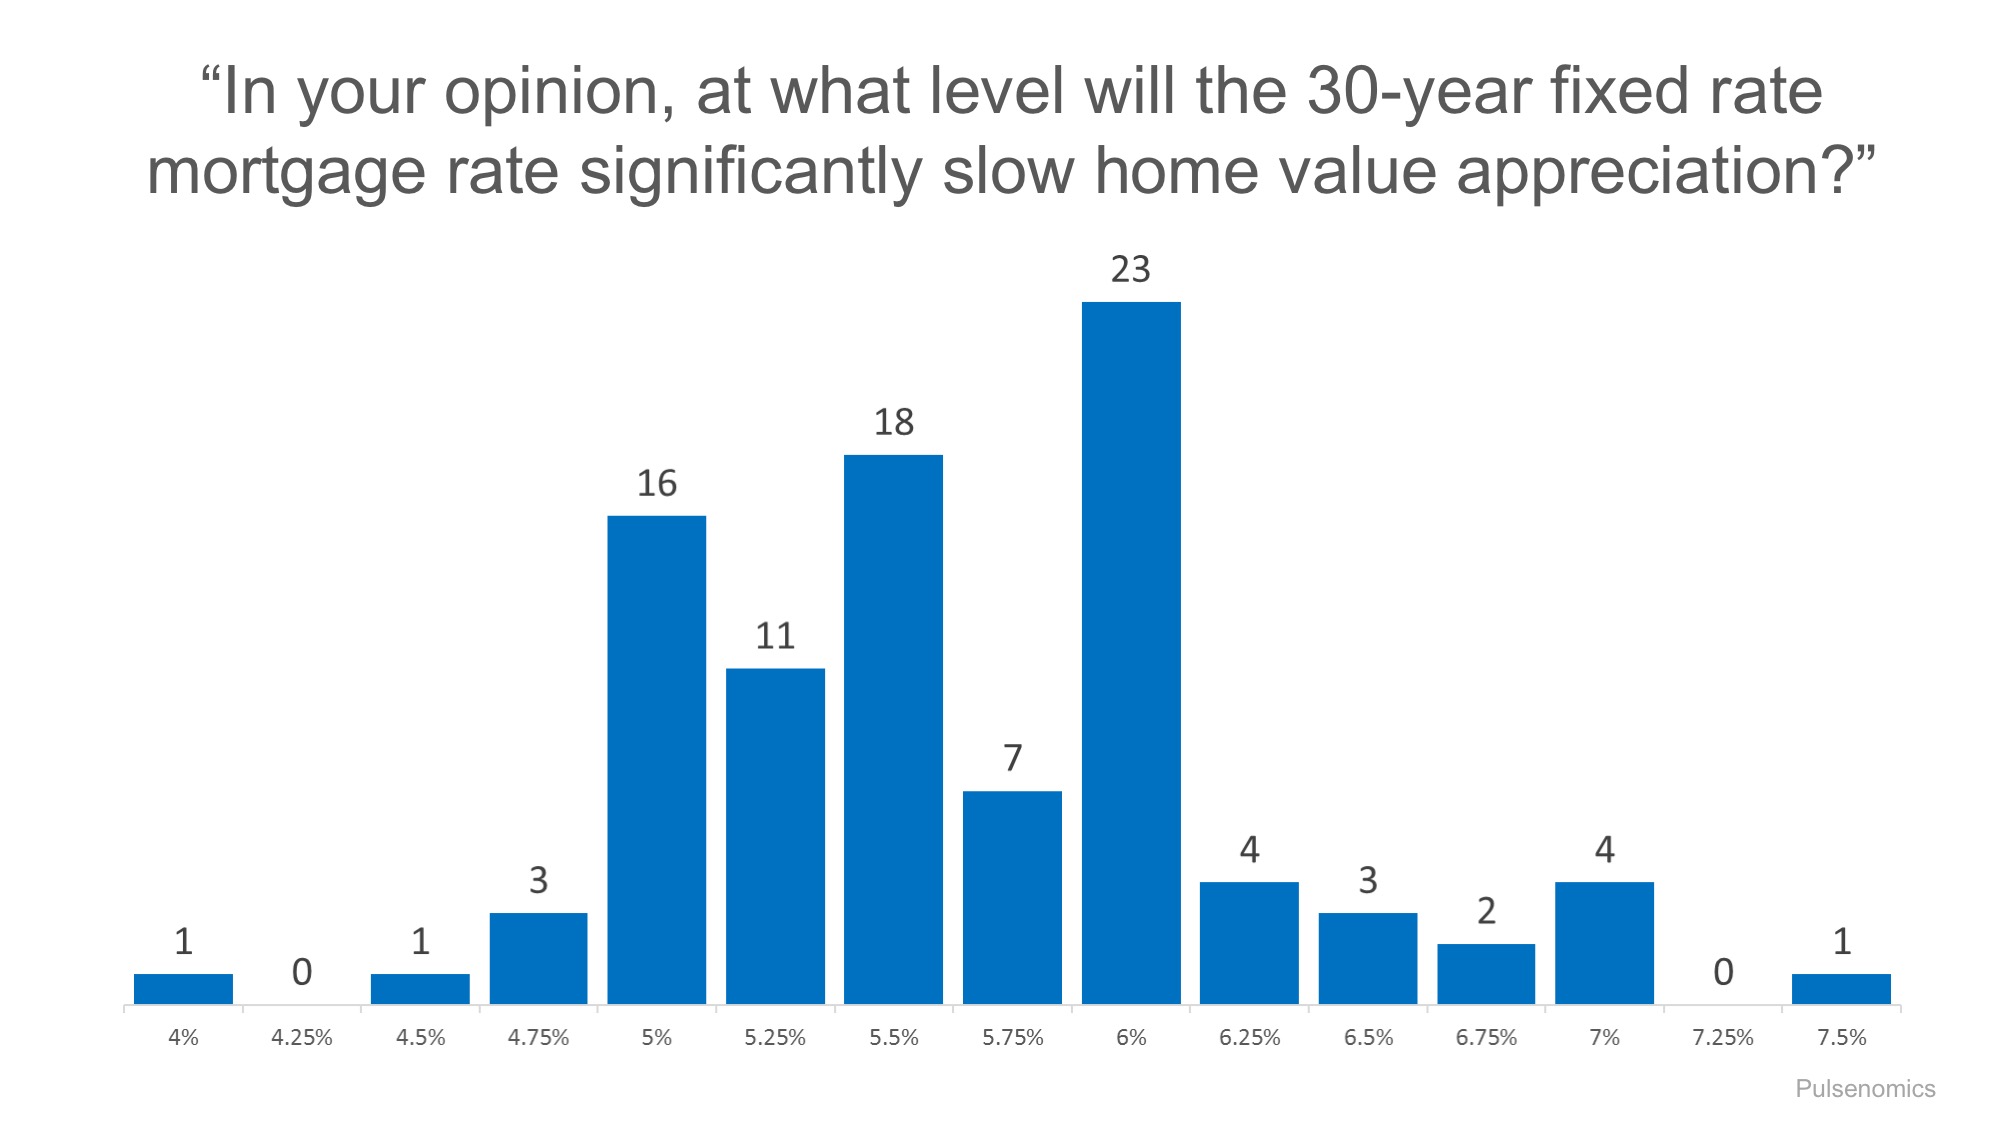
4. There Will Never Be a Better Time to Move-Up

If you are moving up to a larger, more expensive home, consider doing it now. Prices are projected to appreciate by 4.7% over the next 12 months according to CoreLogic. If you are moving to a higher priced home, it will wind-up costing you more in raw dollars (both in down payment and mortgage payment) if you wait. You can also lock-in your 30-year housing expense with an interest rate around 4% right now. Rates are projected to rise by half a percentage point by the end of 2017.

5. It’s Time to Move on with Your Life

Look at the reason you decided to sell in the first place and determine whether it is worth waiting. Is money more important than being with family? Is money more important than your health? Is money more important than having the freedom to go on with your life the way you think you should?

Only you know the answers to the questions above. You have the power to take back control of the situation by putting your home on the market. Perhaps, the time has come for you and your family to move on and start living the life you desire.

That is what is truly important.

Do You Know the Real Cost of Renting vs. Buying?

Do You Know the Real Cost of Renting vs. Buying? [INFOGRAPHIC] | Simplifying The Market

Some Highlights:

  • Historically, the choice between renting or buying a home has been a close decision.
  • Looking at the percentage of income needed to rent a median-priced home today (30%), vs. the percentage needed to buy a median-priced home (15%), the choice becomes obvious.
  • Every market is different. Before you renew your lease again, find out if you could use your housing costs to own a home of your own!

How Does the Reverse Mortgage (HECM) Line of Credit Work?


One of the most powerful features of the Home Equity Conversion Mortgage is that the unused portion of the Line of Credit has a built in guaranteed growth factor. So that once the line is established, it will continue to grow regardless of the home’s value. Some have “asked how is this possible?” And the answer is really pretty simple; it was designed into the program in 1988 and has never changed.

Case Study

  • Pierce and Linda (Ages 62) have a $400,000 home
  • They have an existing Mortgage Balance of $100,000 that carries a monthly payment that they would like to get rid of
  • So they establish a HECM Reverse Mortgage
  • The PRINCIPAL LIMIT (PL) is the amount of money that is made available to them based on (1) the Age of the Youngest Borrower (2) The Value of the Home (up to $625,500) and (3) The current interest rates.
  • Pierce and Linda have $200,000 that is made available to them
  • The HECM must be a first mortgage, so $100,000 is taken out to pay off their existing mortgage and eliminate their mandatory monthly payment. Financed closing costs for this loan are $5,000.
  • So Pierce and Linda’s Initial OUTSTANDING LOAN BALANCE (OB) is $105,000


reloc_-_1


So their Initial LINE OF CREDIT (LOC) of $95,000 is equal to the PRINCIPAL LIMITOUTSTANDING BALANCE

THE BASIC FORMULA
PL – OB = LOC


The First Year

  • The PRINCIPAL LIMIT of the HECM is ALWAYS Growing at the Note Rate: Interest Rate + Lender’s Margin + HUD MIP

(**Notice** This Example just shows the Lender’s Margin + HUD MIP,
because it’s the MINIMUM Growth Factor! Today’s actual growth rate is around 6.1%)

  • So you will notice below that the Principal Limit grew from $200,000 to $210,000 (or by 5%)
  • The OUTSTANDING BALANCE is also ALWAYS Growing at the Note Rate: Interest Rate + Lender’s Margin + HUD MIP
  • Notice it grew from $105,000 to $110,250 (or by 5%)
  • The difference between the Principal Limit and the Outstanding Balance = 1st Years Line of Credit of $99,750

The Subsequent Years:

  • Notice below that the Principal Limit and the Outstanding Balance are Always Growing in a HECM
  • If a voluntary mortgage payment is made, it will reduce the Outstanding Balance, but the Principal Limit will always be growing at the Note Rate
  • Notice below that Line of Credit therefore is growing as well, regardless of the underlying home’s value, the client’s income, assets or credit worthiness

reloc_-_2

reloc_-_3

Join the Retirement Income Conversation HERE

reloc_-_4

So there you have it. A very simple and powerful tool called the HECM Line of Credit. One tool capable of solving so many retirement income challenges.

Don’t Forget the Home Appreciation

Many advisors forget that the underlying asset is still appreciating. Below we show a 3% and 4% average appreciation for illustration sake; actual appreciation will naturally fluctuate. But the point is that the home itself is an appreciating asset. So in this example, one would simply need to subtract the outstanding balance from the potential future home value to determine what passes on to the estate. **Note** In certain scenarios, the home’s equity may be intentionally depleted in order to increase or preserve the overall value of the estate (which could mean preserving Equities from premature depletion, etc).

400k_home_appreciation

Too Good to Be True?

So many have questioned if this is this really true. In August of 2016, AARP Public Policy Institute made a recommendation to congressional policy makers that the HECM Line of Credit (which has functioned the same waysince 1988) was too good and the HUD should consider eliminating the growth feature of the program. I don’t know what will come of this suggestion in the future, but for now, establishing a Standby HECM Line of Credit could be a tremendous financial planning strategy.