Tag Archives: buying a home

How Fast Can You Save for a Down Payment?


How Fast Can You Save for a Down Payment? | MyKCM

Saving for a down payment is often the biggest hurdle for a first-time homebuyer. Depending on where you live, median income, median rents, and home prices all vary. So, we set out to find out how long would it take you to save for a down payment in each state?

Using data from the United States Census Bureau and Zillow, we determined how long it would take, nationwide, for a first-time buyer to save enough money for a down payment on their dream home. There is a long-standing ‘rule’ that a household should not pay more than 28% of their income on their monthly housing expense.

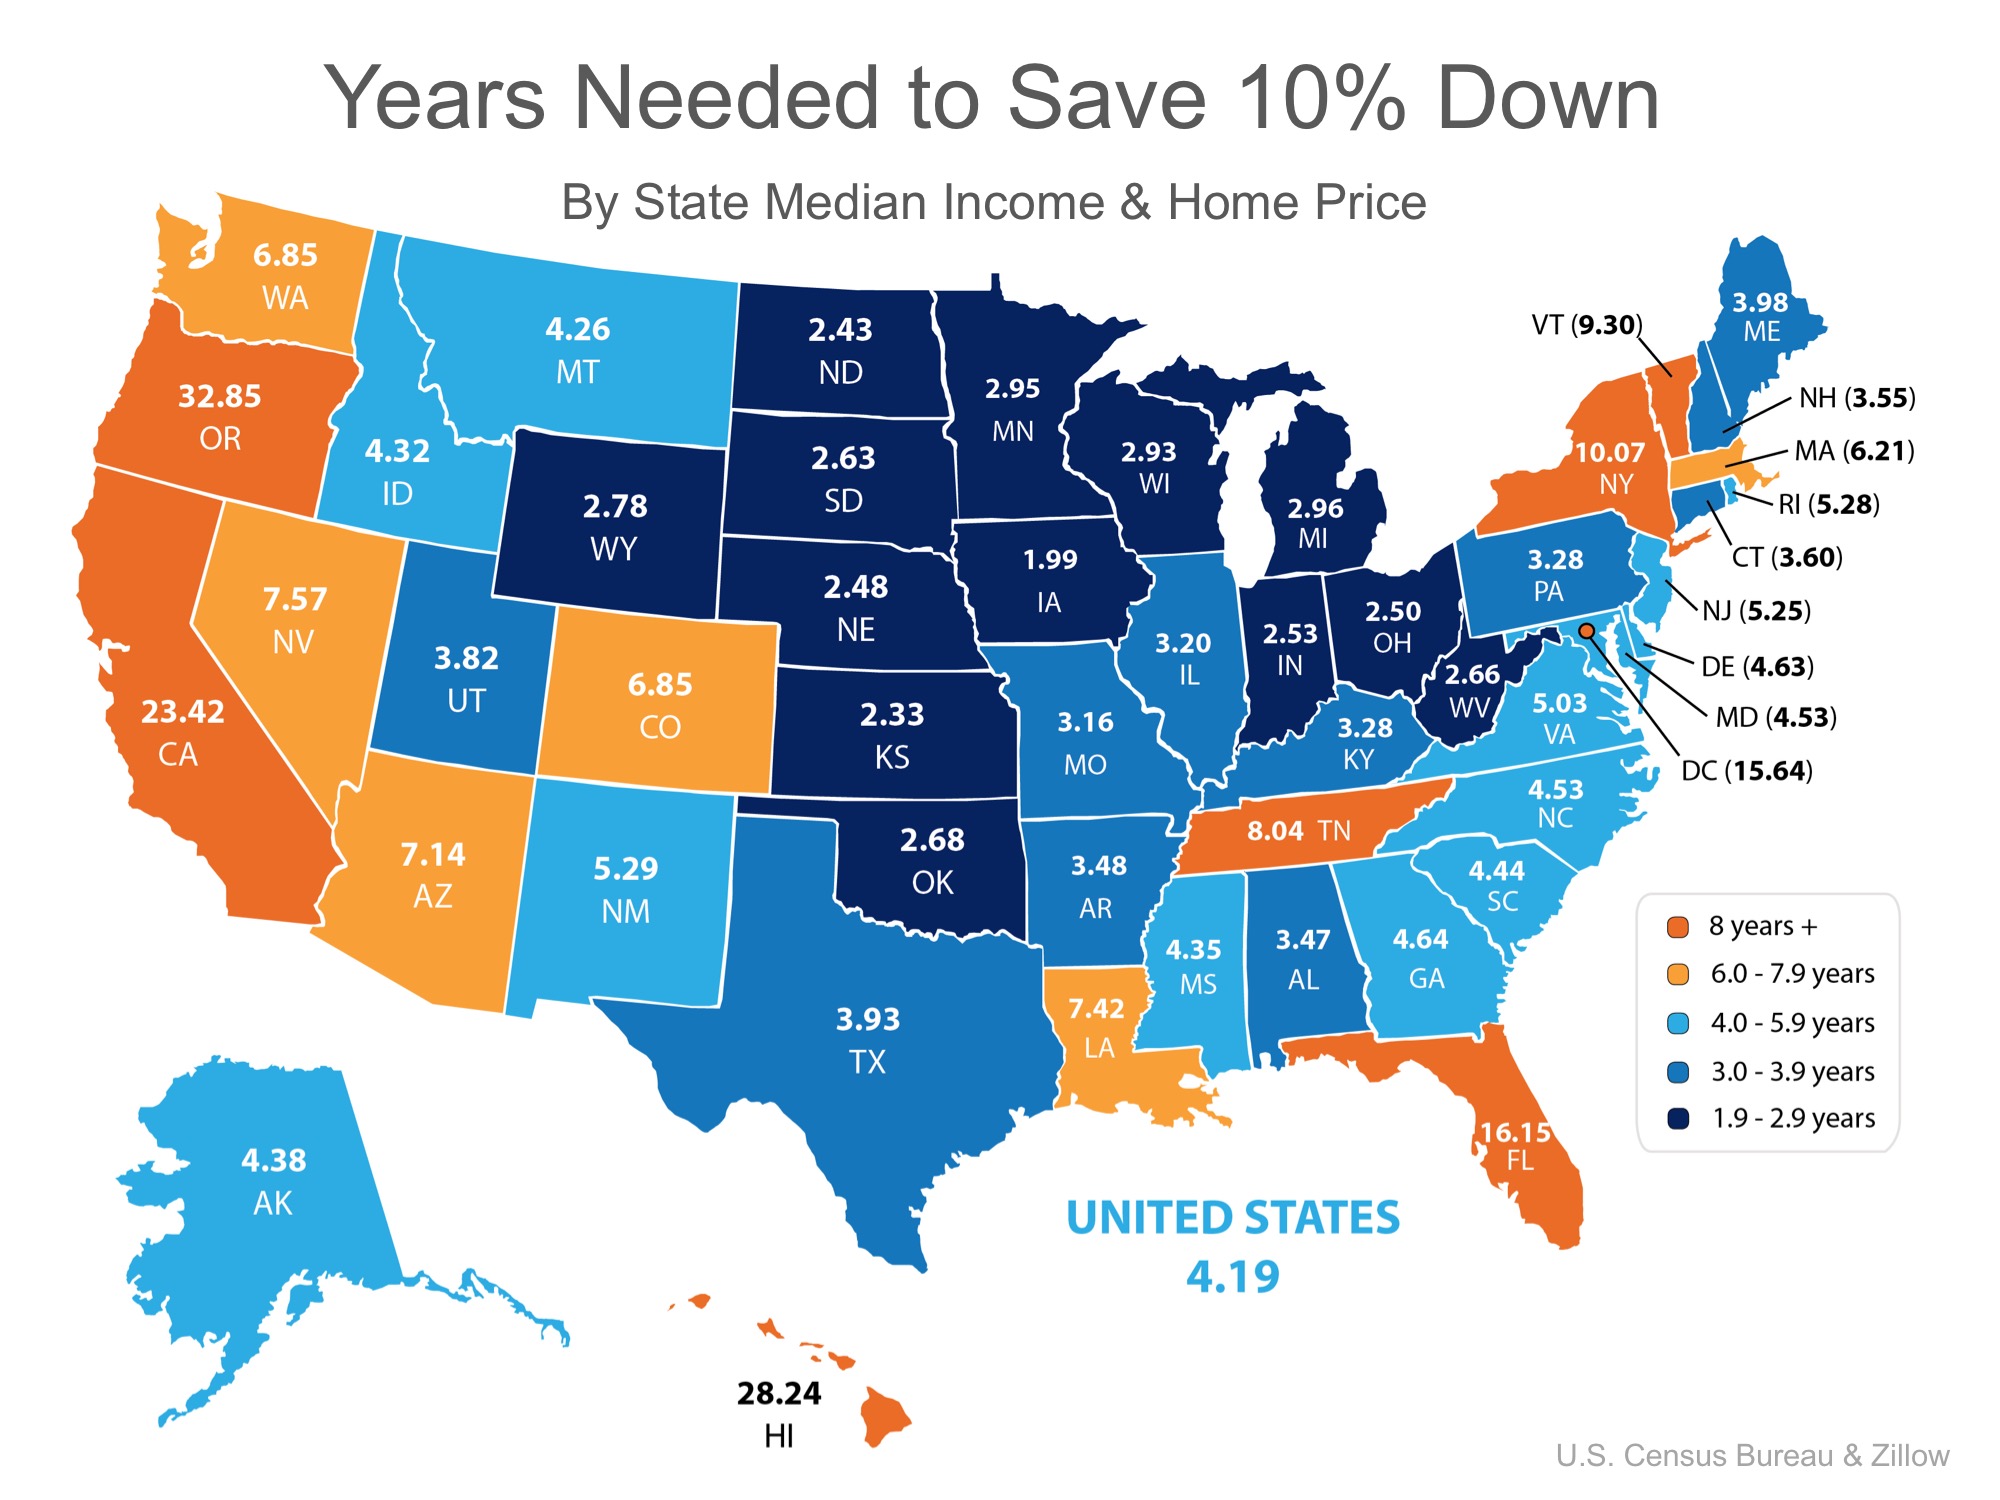
By determining the percentage of income spent renting a 2-bedroom apartment in each state, and the amount needed for a 10% down payment, we were able to establish how long (in years) it would take for an average resident to save enough money to buy a home of their own.

According to the data, residents in Iowa can save for a down payment the quickest in just under 2 years (1.99). Below is a map created using the data for each state:

How Fast Can You Save for a Down Payment? | MyKCM

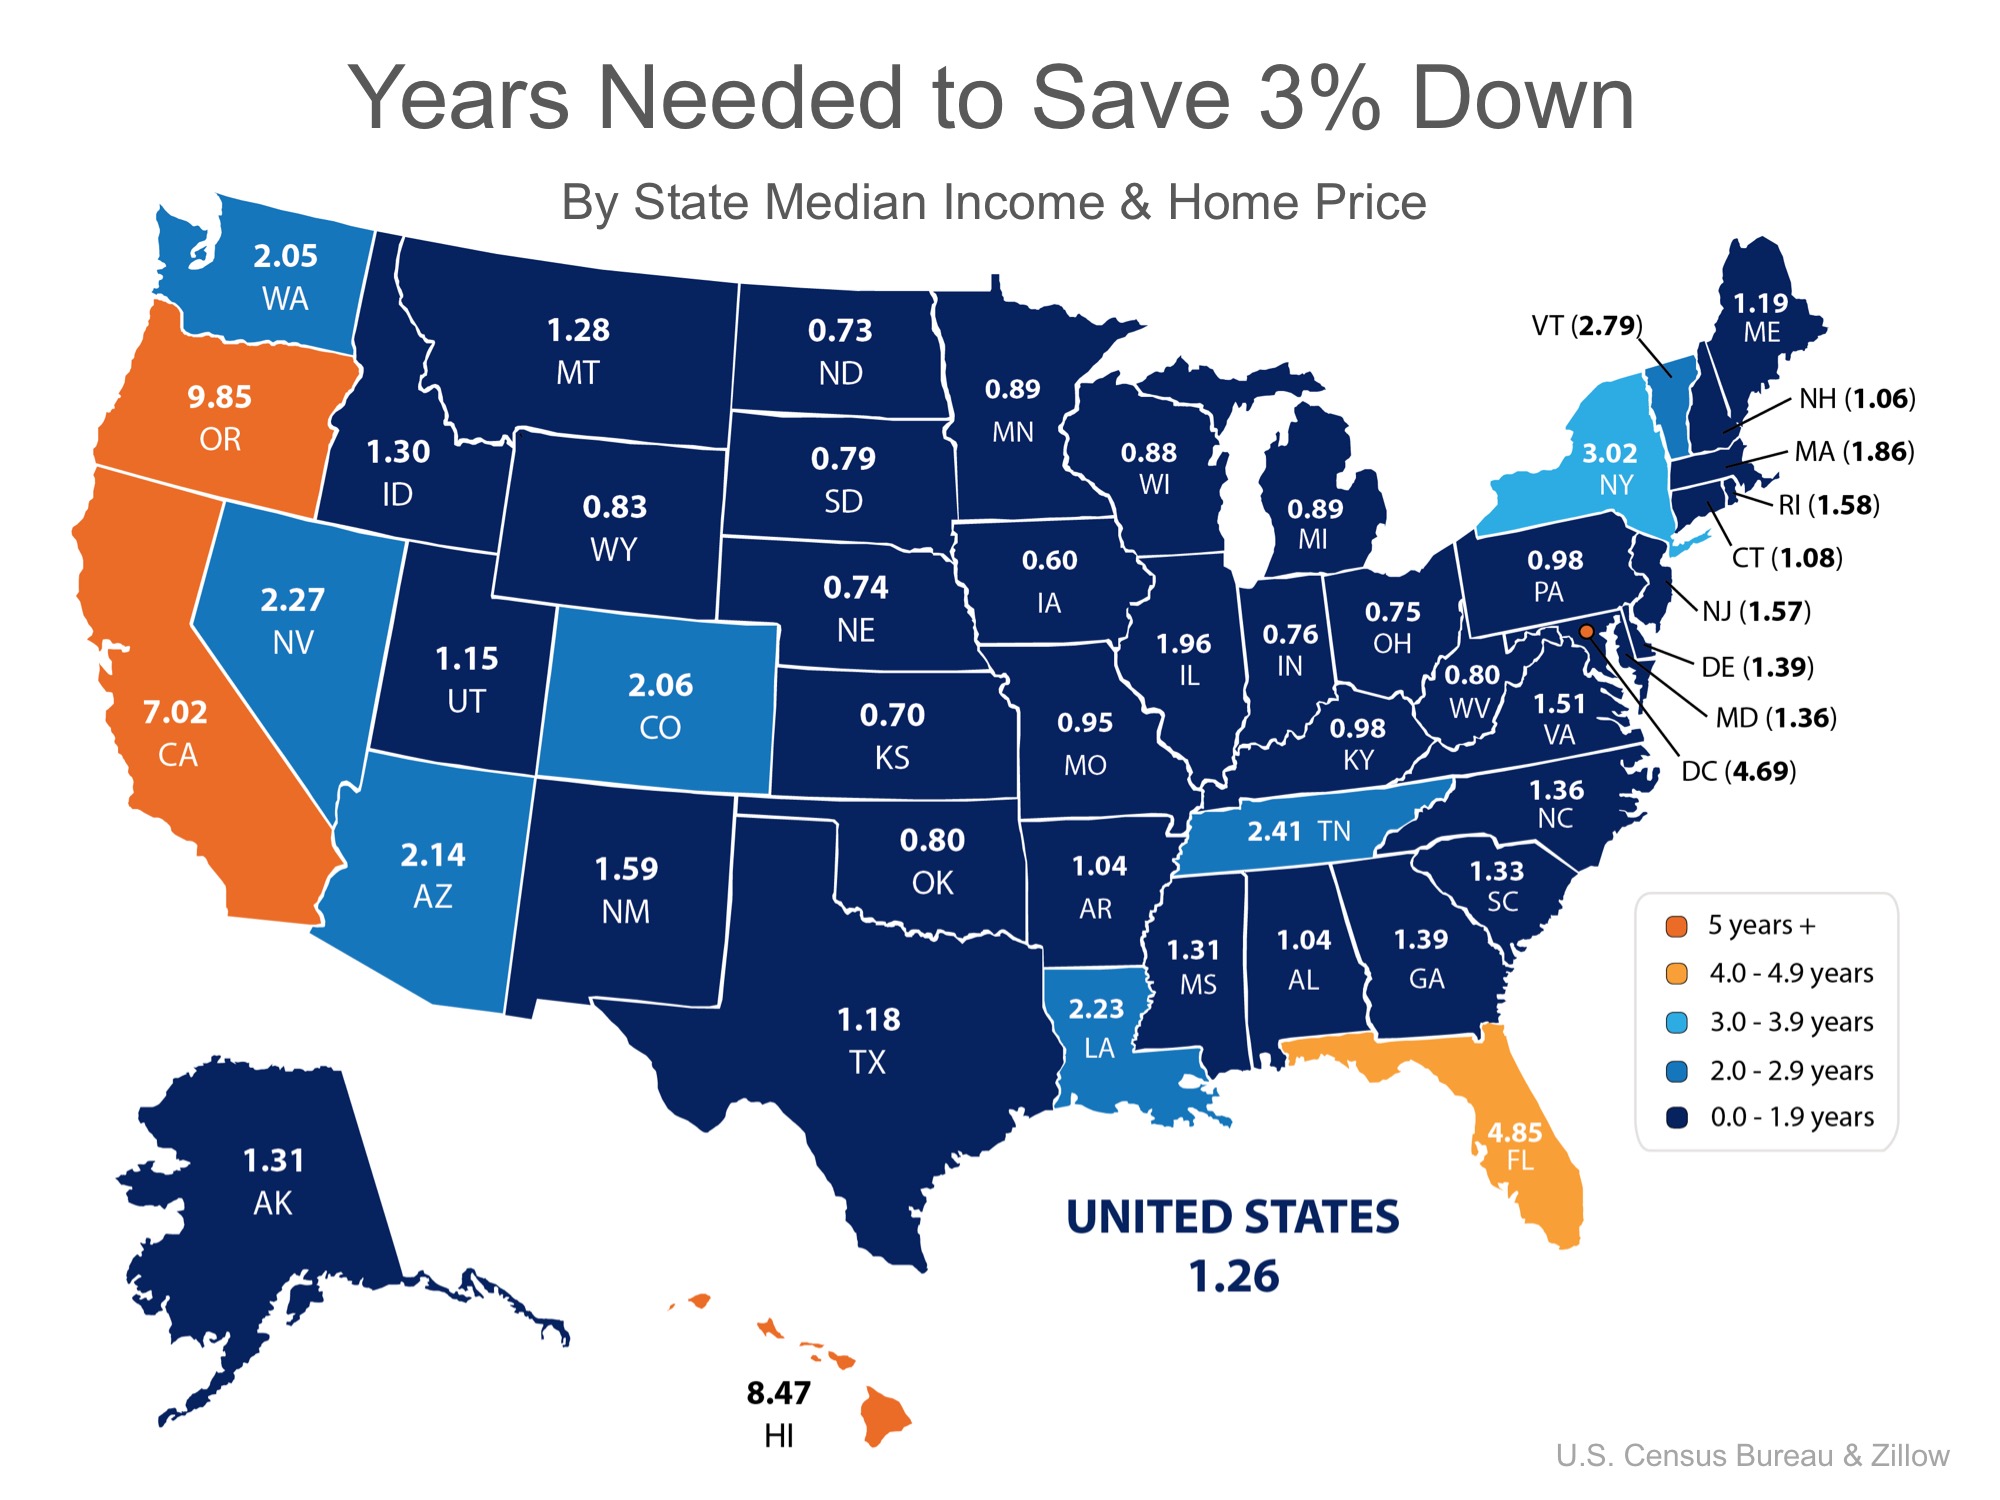
What if you only needed to save 3%?

What if you were able to take advantage of one of Freddie Mac’s or Fannie Mae’s 3% down programs? Suddenly, saving for a down payment no longer takes 5 or 10 years, but becomes attainable in a year or two in many states as shown in the map below.

How Fast Can You Save for a Down Payment? | MyKCM

Bottom Line

Whether you have just started to save for a down payment, or have been saving for years, you may be closer to your dream home than you think! Let’s meet up so I can help you evaluate your ability to buy today.

Slaying Home Buying Myths


Slaying Home Buying Myths [INFOGRAPHIC] | MyKCM

Some Highlights:

  • Interest rates are still below historic numbers.
  • 88% of property managers raised their rent in the last 12 months!
  • The credit score requirements for mortgage approval continue to fall.

The “Real” News about Housing Affordability

The 'REAL' News about Housing Affordability | Simplifying The Market

Some industry experts are claiming that the housing market may be headed for a slowdown as we proceed through 2017, based on rising home prices and a potential jump in mortgage interest rates. One of the data points they use is the Housing Affordability Index, as reported by the National Association of Realtors (NAR).

Here is how NAR defines the index:

“The Housing Affordability Index measures whether or not a typical family earns enough income to qualify for a mortgage loan on a typical home at the national level based on the most recent price and income data.”

Basically, a value of 100 means a family earning the median income earns enough to qualify for a mortgage on a median-priced home, based on the price and mortgage interest rates at the time. Anything above 100 means the family has more than enough to qualify.

The higher the index, the easier it is to afford a home.

Why the concern?

The index has been declining over the last several years as home values increased. Some are concerned that too many buyers could be priced out of the market.

But, wait a minute…

Though the index skyrocketed from 2009 through 2013, we must realize that during that time, the housing crisis left the market with an overabundance of distressed properties (foreclosures and short sales). All prices dropped dramatically and distressed properties sold at major discounts. Then, mortgage rates fell like a rock.

The market is recovering, and values are coming back nicely. That has caused the index to fall.

However, let’s remove the crisis years (shaded in gray) and look at the current index as compared to the index from 1990 – 2008:

The 'REAL' News about Housing Affordability | Simplifying The Market

Though prices and rates appear to be increasing, we must realize that affordability is composed of three ingredients: home prices, interest rates, and income. And, incomes are finally rising.

ATTOM Data Solutions recently released their Q1 2017 U.S. Home Affordability Index. The report explained:

“Stronger wage growth is the silver lining in this report, outpacing home price growth in more than half of the markets for the first time since Q1 2012, when median home prices were still falling nationwide. If that pattern continues, it will help turn the tide in the eroding home affordability trend.”

Bottom Line

Compared to historic norms, it is still a great time to buy from an affordability standpoint.

Renting or Buying… Either way you are paying a mortgage

Renting or Buying… Either Way You’re Paying a Mortgage | Simplifying The Market

There are some people who have not purchased homes because they are uncomfortable taking on the obligation of a mortgage. Everyone should realize that, unless you are living with your parents rent-free, you are paying a mortgage – either yours or your landlord’s.

As Entrepreneur Magazine, a premier source for small business, explained this month in their article, “12 Practical Steps to Getting Rich”:

While renting on a temporary basis isn’t terrible, you should most certainly own the roof over your head if you’re serious about your finances. It won’t make you rich overnight, but by renting, you’re paying someone else’s mortgage. In effect, you’re making someone else rich.”

Christina Boyle, Senior Vice President and head of the Single-Family Sales & Relationship Management organization at Freddie Mac, explains another benefit of securing a mortgage vs. paying rent:

“With a 30-year fixed rate mortgage, you’ll have the certainty & stability of knowing what your mortgage payment will be for the next 30 years – unlike rents which will continue to rise over the next three decades.”

As an owner, your mortgage payment is a form of ‘forced savings’ which allows you to build equity in your home that you can tap into later in life. As a renter, you guarantee the landlord is the person with that equity.

Interest rates are still at historic lows, making it one of the best times to secure a mortgage and make a move into your dream home. Freddie Mac’s latest report shows that rates across the country were at 4.23% last week.

Bottom Line

Whether you are looking for a primary residence for the first time or are considering a vacation home on the shore, now may be the time to buy.

A Tale of Two Markets….

A Tale of Two Markets: Inventory Mismatch Paints a More Detailed Picture | Simplifying The Market

A Tale of Two Markets: Inventory Mismatch Paints a More Detailed Picture

The inventory of existing homes for sale in today’s market was recently reported to be at a 3.6-month supply according to the National Association of Realtors latest Existing Home Sales Report. Inventory is now 7.1% lower than this time last year, marking the 20th consecutive month of year-over-year drops.

Historically, inventory must reach a 6-month supply for a normal market where home prices appreciate with inflation. Anything less than a 6-month supply is a sellers’ market, where the demand for houses outpaces supply and prices go up.

As you can see from the chart below, the United States has been in a sellers’ market since August 2012, but last month’s numbers reached a new low.

A Tale of Two Markets: Inventory Mismatch Paints a More Detailed Picture | Simplifying The Market

Recently Trulia revealed that not only is there a shortage of homes on the market in general, but the homes that are available for sale are not meeting the needs of the buyers that are searching.

Homes are generally bucketed into three groups by price range: starter, trade-up, and premium.

Trulia’s market mismatch score measures the search interest of buyers against the category of homes that are available on the market. For example: “if 60% of buyers are searching for starter homes but only 40% of listings are starter homes, [the] market mismatch score for starter homes would be 20.”

The results of their latest analysis are detailed in the chart below.

A Tale of Two Markets: Inventory Mismatch Paints a More Detailed Picture | Simplifying The Market

Nationally, buyers are searching for starter and trade-up homes and are coming up short with the listings available, leading to a highly competitive seller’s market in these categories. Ninety-two of the top 100 metros have a shortage in trade-up inventory.

Premium homebuyers have the best chance of less competition and a surplus of listings in their price range with an 11-point surplus, leading to more of a buyer’s market.

“It leaves Americans who are in the market for a home increasingly chasing too fewer options in lower price ranges, and sellers of premium homes more likely to be left waiting longer for a buyer.”

 Lawrence Yun, NAR’s Chief Economist doesn’t see an end to this coming any time soon: 

“Competition is likely to heat up even more heading into the spring for house hunters looking for homes in the lower- and mid-market price range.”

Bottom Line

Real estate is local. If you are thinking about buying OR selling this spring, let’s get together to discuss the exact market conditions in your area.

Thinking of Selling? Do it TODAY!!

Thinking of Selling? Do it TODAY!! | Simplifying The Market

That headline might be a little aggressive. However, as the data on the 2017 housing market begins to roll in, we can definitely say one thing: If you are considering selling, IT IS TIME TO LIST YOUR HOME!

The February numbers are not in yet, but the January numbers were sensational. Lawrence Yun, Chief Economist for the National Association of Realtors, said:

“Much of the country saw robust sales activity last month as strong hiring and improved consumer confidence at the end of last year appear to have sparked considerable interest in buying a home. Market challenges remain, but the housing market is off to a prosperous start as homebuyers staved off inventory levels that are far from adequate…”

And CNBC says consumer confidence in the economy is fueling the market:

“U.S. home resales surged to a 10-year high in January as buyers shrugged off higher prices and mortgage rates, a sign of growing confidence in the economy.”

The only challenge to the market is a severe lack of inventory. A balanced market would have a full six-month supply of homes for sale. Currently, there is less than a four-month supply of inventory. This represents a decrease in supply of 7.1% from the same time last year.

Bottom Line

With demand increasing and supply dropping, this may be the perfect time to get the best price for your home. Let’s get together and discuss the inventory levels in your neighborhood to determine your next steps.

The Connection Between Home Prices & Family Wealth

The Connection Between Home Prices & Family Wealth | Simplifying The Market

Over the next five years, home prices are expected to appreciate 3.22% per year on average and to grow by 17.3% cumulatively, according to Pulsenomics’ most recent Home Price Expectation Survey.

So, what does this mean for homeowners and their equity position?

As an example, let’s assume a young couple purchased and closed on a $250,000 home in January. If we look at only the projected increase in the price of that home, how much equity will they earn over the next 5 years?

The Connection Between Home Prices & Family Wealth | Simplifying The Market

Since the experts predict that home prices will increase by 4.4% this year alone, the young homeowners will have gained $11,000 in equity in just one year.

Over a five-year period, their equity will increase by nearly $43,000! This figure does not even take into account their monthly principal mortgage payments. In many cases, home equity is one of the largest portions of a family’s overall net worth.

Bottom Line

Not only is homeownership something to be proud of, but it also offers you and your family the ability to build equity you can borrow against in the future. If you are ready and willing to buy, find out if you are able to today!

How Long do Most Families Stay in Their Home?

How Long Do Most Families Stay in Their Home? | Simplifying The Market

The National Association of Realtors (NAR) keeps historical data on many aspects of homeownership. One of the data points that has changed dramatically is the median tenure of a family in a home. As the graph below shows, for over twenty years (1985-2008), the median tenure averaged exactly six years. However, since 2008, that average is almost nine years – an increase of almost 50%.

How Long Do Most Families Stay in Their Home? | Simplifying The Market

Why the dramatic increase?

The reasons for this change are plentiful!

The fall in home prices during the housing crisis left many homeowners in a negative equity situation (where their home was worth less than the mortgage on the property). Also, the uncertainty of the economy made some homeowners much more fiscally conservative about making a move.

With home prices rising dramatically over the last several years, 93.7% of homes with a mortgage are now in a positive equity situation with 79.1% of them having at least 20% equity, according to CoreLogic.

With the economy coming back and wages starting to increase, many homeowners are in a much better financial situation than they were just a few short years ago.

One other reason for the increase was brought to light during a recent presentation by Lawrence Yun, the Chief Economist of NAR, at the Realtor’s Summit in San Diego, CA. Yun pointed to the fact that historically, young homeowners who were either looking for more space to accommodate their growing family or looking for a better school district were more likely to move more often (every 5 years). The homeownership rate among young families, however, has still not caught up to previous generations resulting in the jump we have seen in median tenure!

What does this mean for housing?

Many believe that a large portion of homeowners are not in a house that is best for their current family circumstances. They could be baby boomers living in an empty, four-bedroom colonial, or a millennial couple planning to start a family that currently lives in a one-bedroom condo.

These homeowners are ready to make a move. Since the lack of housing inventory is a major challenge in the current housing market, this could be great news.

Existing Home Sales Reach Highest Mark Since 2007

Existing Home Sales Reach Highest Mark Since 2007 [INFOGRAPHIC] | Simplifying The Market

Highlights:

  • Sales of existing homes reached the highest pace in a decade at a seasonally adjusted annual rate of 5.69 million.
  • January marked the 59th consecutive month of year-over-year price gains as the median home price rose 7.1% to $228,900.
  • NAR’s Chief Economist, Lawrence Yun had this to say, “Much of the country saw robust sales activity last month as strong hiring and improved consumer confidence at the end of last year appear to have sparked considerable interest in buying a home.” 

Are You 1 of the 59 Million…

Are You 1 of the 59 Million Planning to Buy This Year? | Simplifying The Market

Are You 1 of the 59 Million Planning to Buy This Year?

According to a survey conducted by Bankrate.com, one in four Americans are considering buying a home this year. If this statistic proves to be true, that means that 59 million people will be looking to enter the housing market in 2017.

The survey also revealed 3 key takeaways:

  1. Those most likely to buy are ‘Older Millennials’ (ages 27-36) or ‘Generation X’ (ages 37-52)
  2. Minorities, particularly African-Americans, were twice as likely to respond that they were considering purchasing a home this year than white respondents.
  3. Many potential buyers believe they need to put 20% down and need to have perfect credit to own and are unaware of programs that would allow them to buy now.

Holden Lewis, a mortgage analyst for Bankrate.com, pointed to one big reason why many Americans are starting to consider homeownership:

“Having kids and raising a family is a primary reason why Americans take the leap into homeownership—many consider it a key component of the American dream.”

Bottom Line

If buying a home is a part of your dream for 2017, let’s get together to determine if you are able to.